Force Cart Lab
Force Cart Lab Worksheet is Attached Here
The goal of this lab is to determine the total friction that is exerted on the system of carts as they move.
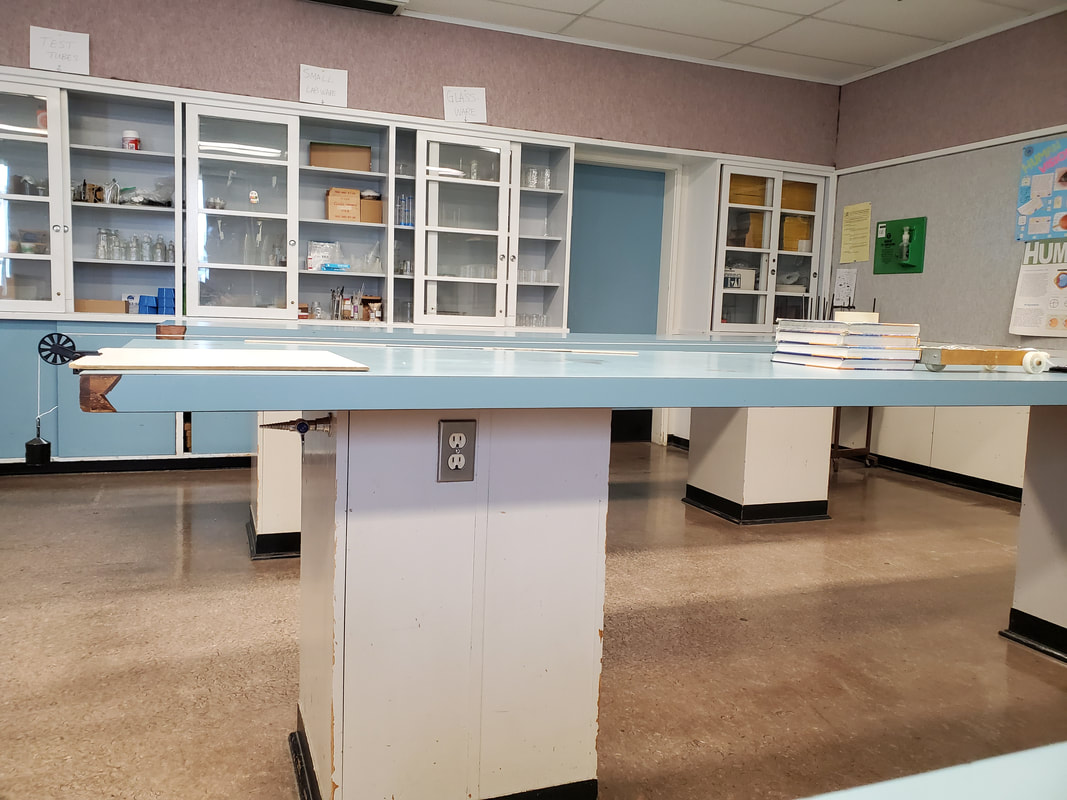
The setup is a cart, connected to a mass by a string. The cart is placed on the table and the mass is hung off the edge. The string is put onto a pulley. It looks like the following picture:
The goal of this lab is to determine the total friction that is exerted on the system of carts as they move.
The setup is a cart, connected to a mass by a string. The cart is placed on the table and the mass is hung off the edge. The string is put onto a pulley. It looks like the following picture:
The mass of the cart is: 0.824kg
The hanging mass is: 0.20kg
The ticker tape device was activated and the system was allowed to fall. As can be seen in the attached video.
The hanging mass is: 0.20kg
The ticker tape device was activated and the system was allowed to fall. As can be seen in the attached video.
The tape was lined up to a meterstick and marked.
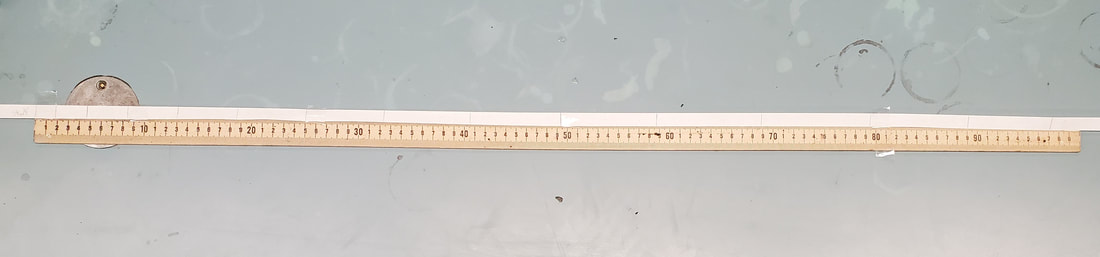
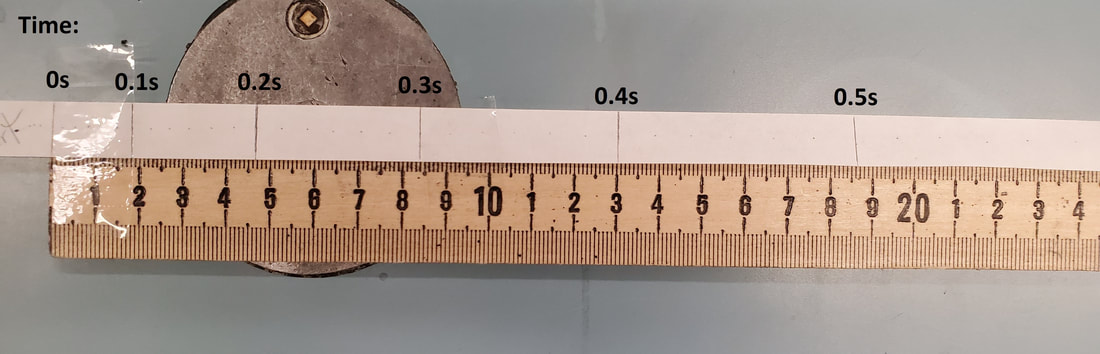
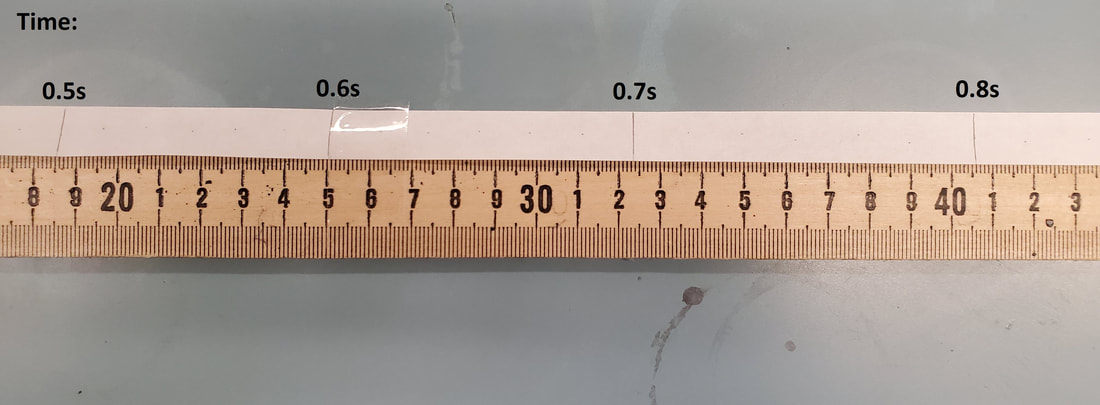
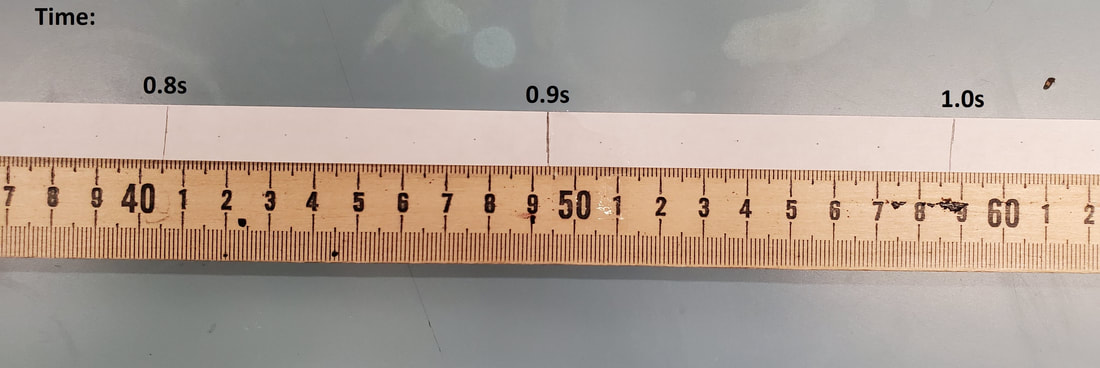
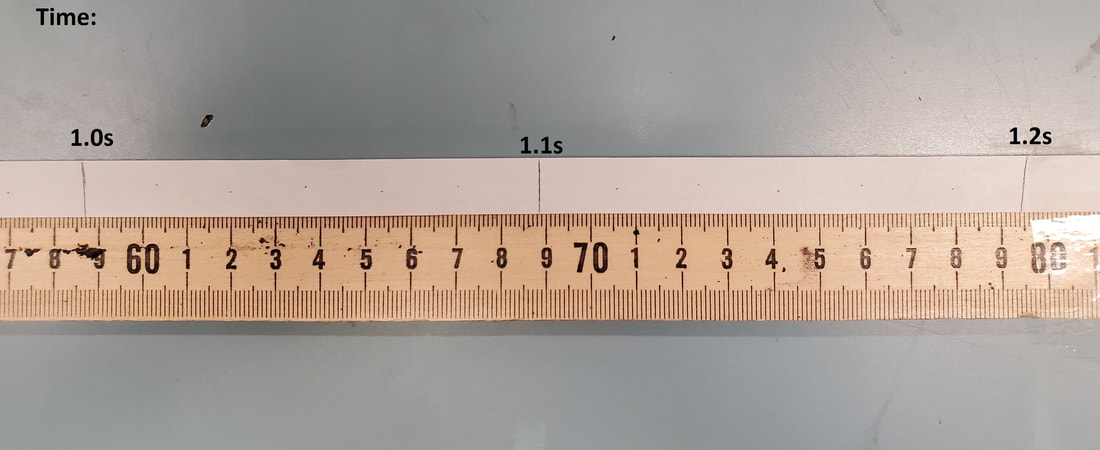
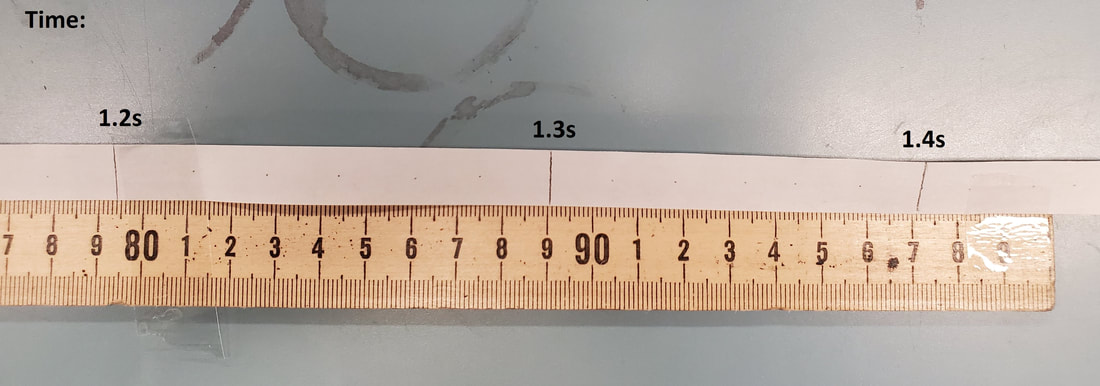
The tape has been marked at every 6 dots; remember, every 6 dots will be 0.10s, so you should measure exactly where you view the line. Determine the position at each time and put it into your data table. The following pictures are close ups of the meterstick to help you take measurements with higher resolution. The times of each line is marked on the photos to help you keep track. Click on each photo to view the whole image.
When you have collected your data, you can find the change in position between each time period and calculate the velocity for each time period.
To determine the acceleration, you must use the best fit line of a velocity-time graph of your data. Remember we do this to reduce the impact of random errors in our experimental methods.
I recommend using the Desmos Online Graphing Calculator to do your graph, but you may do your graph by hand. If you need help, please view the Desmos Tutorial Videos:
Inputting Data and Resizing the View Screen:
Making a Best Fit Line
Continue by following the instructions on the Lab Sheet. Answer all questions and make sure to show all parts of your work. Submit your completed lab sheet and don't forget to share your graph with it.
